Preface / Motivation
Recently, our production environment became unreachable due to our (Kotlin) application using up all available JVM memory. As up to then we did not monitor availability, we only got aware of the problem after a customer contacted support. So we had a quite significant downtime: starting from the moment the incident occurred plus recognition delay (customer report) plus reaction time by us developers (i.e. quick-fixing by giving more memory to the JVM – investigating the cause was then after-math).
After the incident it was clear that we needed some kind of monitoring coupled with some notification mechanism in case of alarms (especially for memory surveillance) in order to react early – ideally before the customer even recognizes/experiences problems.
The Notification Solution – Keep Track on Elastic Beanstalk
environmental Health
We are hosting our booking application for bike parking facilities on an AWS EC2 instance, managed by Elastic Beanstalk service. Unfortunately AWS does not provide any solution to measure or display memory consumption.
So the first thing we did was to customize our health endpoint and extend it with additional information concerning memory consumption of our Java process. The result mainly looks like this:
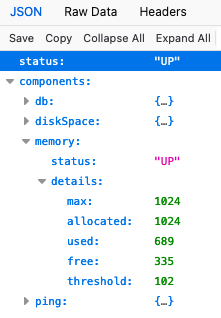
As soon as the free value drops below the (configurable) threshold, the memory status goes to “OUT_OF_SERVICE” – which is also propagated to the overall health status.
Afterwards, we added an alarm on our Elastic Beanstalk environment (go to AWS Console → Elastic Beanstalk → Environments → { your environment } → Tab Alarms → Button Create a new Alarm.
- Select your environment as resource
- Metric “EnvironmentHealth”
- As statistic we chose “Minimum”
- Period → the validation frequency, e.g. 1 minute
- Choose a meaningful value for Threshold in combination with “Change state after” (we recommend to not make it too small in order to avoid triggering the alarm on some short-time “lows”, e.g. after system restart – this however depends on the individual memory consumption behaviour of your application)
- Create a new SNS topic or reuse an existing one in order to be informed via E-Mail
- Choose a speaking description as that would be contained in your E-Mail text (customizing the content is not possible out-of-the-box and the generated default text might be quite cryptic)
- We chose to only be informed in case of “Alarm”
Tip: We also set up AWS Chatbot and subscribed it to the SNS topic in order to additionally get informed via Slack-channel. See [1] on how to do that.
The Visualization Solution – Display custom Metrics on AWS CloudWatch
Although now we would be informed if memory drops below a certain value, we still would not be able to detect abnormalities including small memory leaks ( i.e. decreasing memory tendencies even after garbage collections triggered by the JVM).
Overview of necessary Steps
- Create new Data Source
- Create Lambda function to receive data to be displayed
- Show that data in a Graph
- Create Event that periodically triggers the Lambda function
- Create Dashboard that makes use of the data source
Step 3 is kind of optional as the data will only be shown as long as the graph is displayed. As soon as the screen is reloaded or you log out and in again, already displayed values will be gone – there’s no historical data being available. That’s achieved by step 4 which will also have an affect on “sporadically” created graphs as done in step 3 (as historical values will be shown).
Create a new Data Source
We use the template wizard to create this data source as this will help to automatically create needed roles and policies.
Go to AWS Console → CloudWatch → Settings → Tab Metrics data sources → Create data source
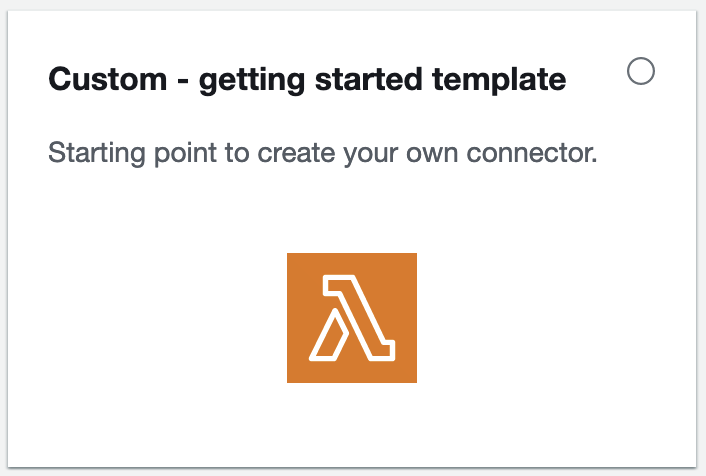
Choose “Custom…” → Button “Next”
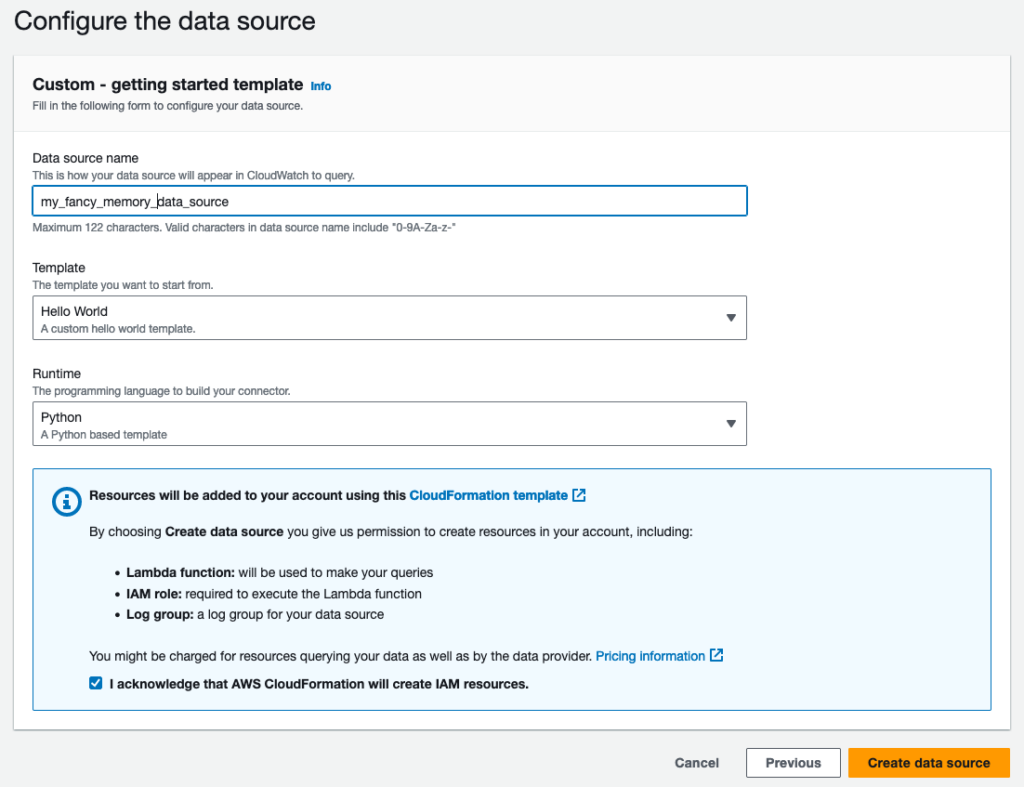
- Name: Put in a meaningful name (better than my bad example
)
- Template: select the hello world → we will later adapt the name and replace the function’s content
- Runtime: Python (as I personally prefer Python over JavaScript, you can of course also write the solution for any other runtime that is supported for AWS Lambda functions)
- Tick “I acknowledge…” to allow AWS handle creation of all required resources. Unless you like to go through painful processed, I would highly recommend this setting.
One remark concerning costs: there’s a free-tier for calling Lambda functions. If you don’t exaggerate by calling your function “too often” and/or have lots functions being called frequently, you normally should not exceed the given limits (currently 1 million lambda function calls per month before you get charged).
It now might take a while until your data source is accessible.

If it is, you will be automatically forwarded to the “Configured data sources” view in the CloudWatch settings. You can then click on “View in Lambda console” and continue with next chapter.
Adapt Lambda Function to request Health Data
1. Adapt Settings / Prepare runtime
With the creation of the data source we also created a Lambda function. If you did not open it from “Configured data sources” view from previous chapter you can also select it by opening (AWS) Lambda service.
First we will rename the hello-world package and then update the Python runtime from 3.8 to 3.12.
Make sure to select “Code” tab, in the “Environment” window right-click on “hello-world”, then “Rename”:
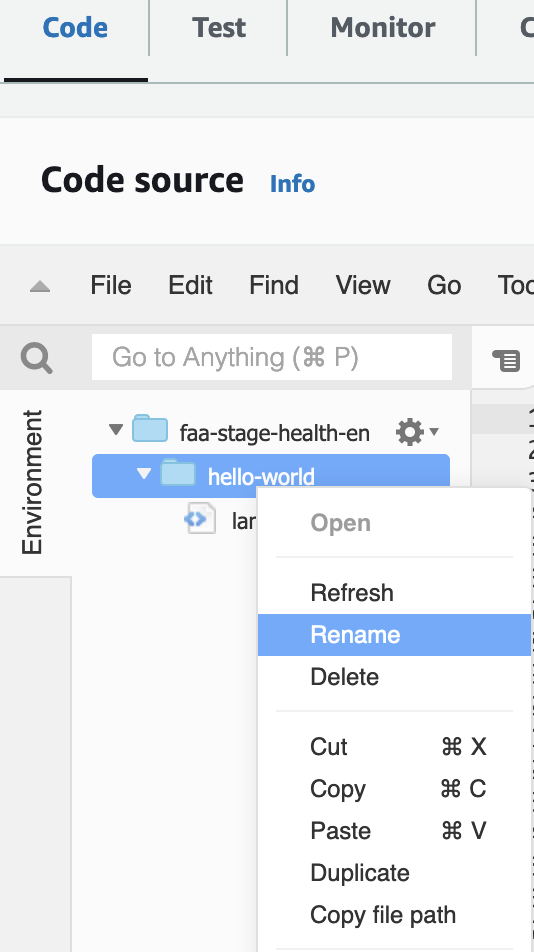
I chose “memory” as new package name.
Scroll down to section “Runtime settings” and choose “Edit”. Select “Python 3.12” as runtime and in the handler-section replace ‘hello-world’ in the path (in my case) with ‘memory’. You can also rename the lambda function and the name of the handler function – I left it as is, however.
Next, we will set the target URL for our health REST-endpoint as environment variable. Select Configuration tab → Environment variables → Edit
Key: HEALTH_ENDPOINT, Value: Your health endpoint URL (if you chose the same solution as we did)
2. Add missing permissions
If you would now try to test your code, the response would contain an error message:
"errorMessage": "An error occurred (AccessDenied) when calling the PutMetricData operation...Although we kindly asked AWS to create stuff for us, we still lack some permission to allow our Lambda function to publish data to the CloudWatch service.
If you know the role name, you can directly search for it in → IAM → Roles. As I assume that you don’t, here’s an alternative way to go there:
In the Lambda view, choose → Configuration tab → menu entry Permissions. Below “Execution role”, the role name is shown as clickable link. On permissions tab, scroll down to “Permissions policies”, click on “Add permissions” button → Create inline policy
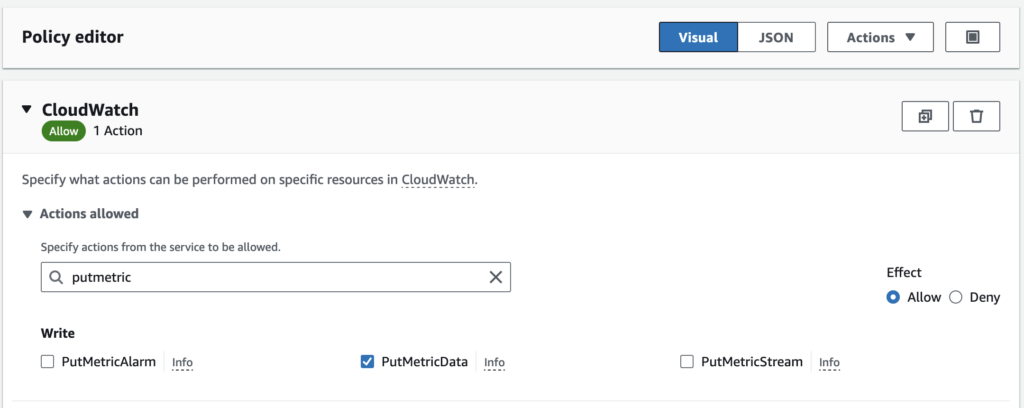
Select “CloudWatch” as service in policy editor and pre-filter by typing “putmetric” in allowed actions field.
Select “Effect: Allow” and write action “PutMetricData”
Click “Next”.
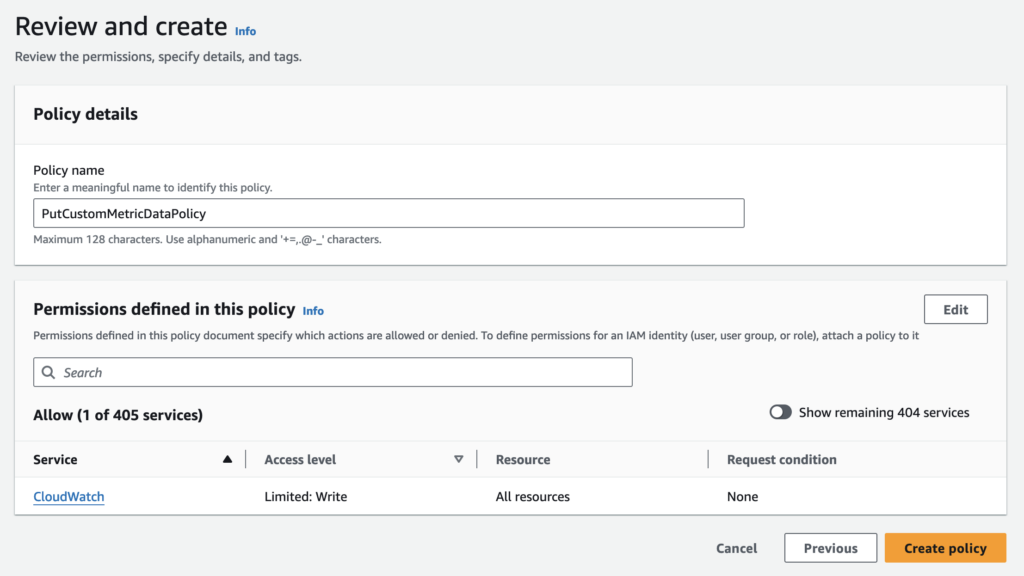
Click “Create policy”.
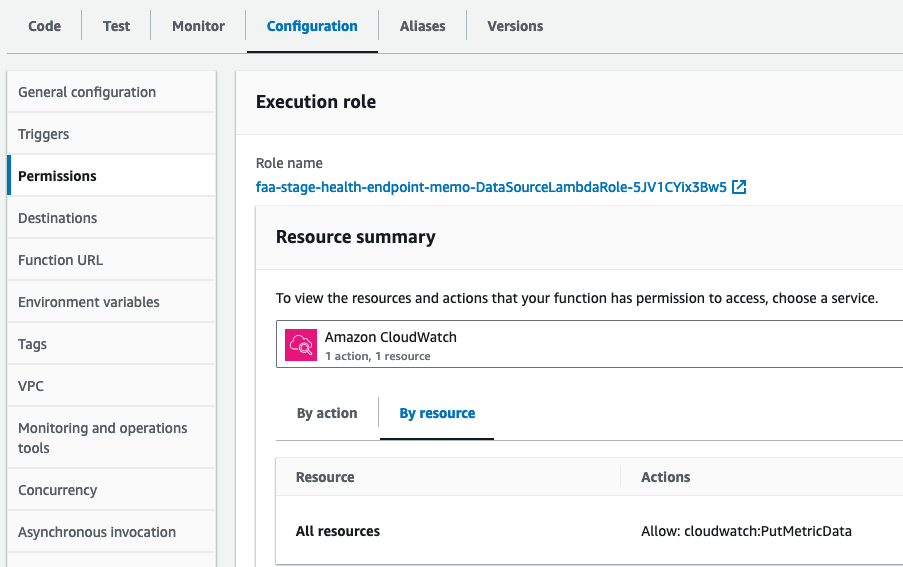
Go back to → Lambda → Configuration Tab → Permissions Menu. You should be able to choose CloudWatch Service from the drop-down below Resource summary. If you do so, you should be able to see the allowed action as shown below:
3. Adapt Python Code
I used the hello-world example as template and adapted it to my needs in order to extract memory values from the health endpoint depending on the chosen input parameter (supported are “free” and “threshold”). Although the threshold is principally configurable, it should not change over time – unless we decide to adapt it after collecting some experience with our application’s memory consumption).
This is the resulting code:
import urllib.request
import json
import boto3
import os


def get_memory():
    res = urllib.request.urlopen(urllib.request.Request(
        url=os.environ.get('HEALTH_ENDPOINT'),
        headers={'Accept': 'application/json'},
        method='GET'),
        timeout=5)
    content = json.loads(res.read())
    return content['components']['memory']['details']

def validation_error(message):
    return {
        'Error': {
            'Code': 'Validation',
            'Value': message,
        }
    }

def validate_get_metric_data_event(event):
    arguments = event['GetMetricDataRequest']['Arguments']

    if len(arguments) != 1:
        return validation_error('Argument count must be 1')

    if not isinstance(arguments[0], str):
        return validation_error('Argument 1 must be a string')

    return None

def get_metric_data(event):
    validation_error = validate_get_metric_data_event(event)

    if validation_error:
        return validation_error

    metric_name = event['GetMetricDataRequest']['Arguments'][0]

    print('metric: ' + metric_name)

    memory = get_memory()
    freeMem = memory['free']
    threshold = memory['threshold']
    value = 0
    if metric_name == 'free':
        value = freeMem
    elif metric_name == 'threshold':
        value = threshold

    cloudwatch = boto3.client('cloudwatch')
    response = cloudwatch.put_metric_data(
        MetricData = [
            {
                'MetricName': metric_name + ' memory',
                'Dimensions': [
                    {
                        'Name': 'Metric',
                        'Value': 'Memory Usage'
                    },
                    {
                        'Name': 'Version',
                        'Value': '1'
                    },
                ],
                'Unit': 'Megabytes',
                'Value': value
            },
        ],
        Namespace = 'FAA'
    )
    print('value: ' + str(value))
    return response


def describe_get_metric_data():
    description = f"""## Custom Metric for Memory Usage

returns memory values based on requested input (free memory, threshold)

### Query arguments

\\# | Type | Description
---|---|---
1 | String | The type of memory (free, threshold)

### Example Expression

```
LAMBDA('{os.environ.get('AWS_LAMBDA_FUNCTION_NAME')}', 'free')
```
"""

    return {
        'ArgumentDefaults': [{'Value': 'free'}],
        'Description': description
    }


def lambda_handler(event, context):
    if event['EventType'] == 'GetMetricData':
        return get_metric_data(event)

    if event['EventType'] == 'DescribeGetMetricData':
        return describe_get_metric_data()

    return validation_error('Invalid event type: ' + event['EventType'])
The most interesting part is the construction of the MetricData and transferring it to CloudWatch (l. 55ff).
4. Test the implementation
By now, you should already be available to test your function. Below Code → Code source, choose Test → Configure test event
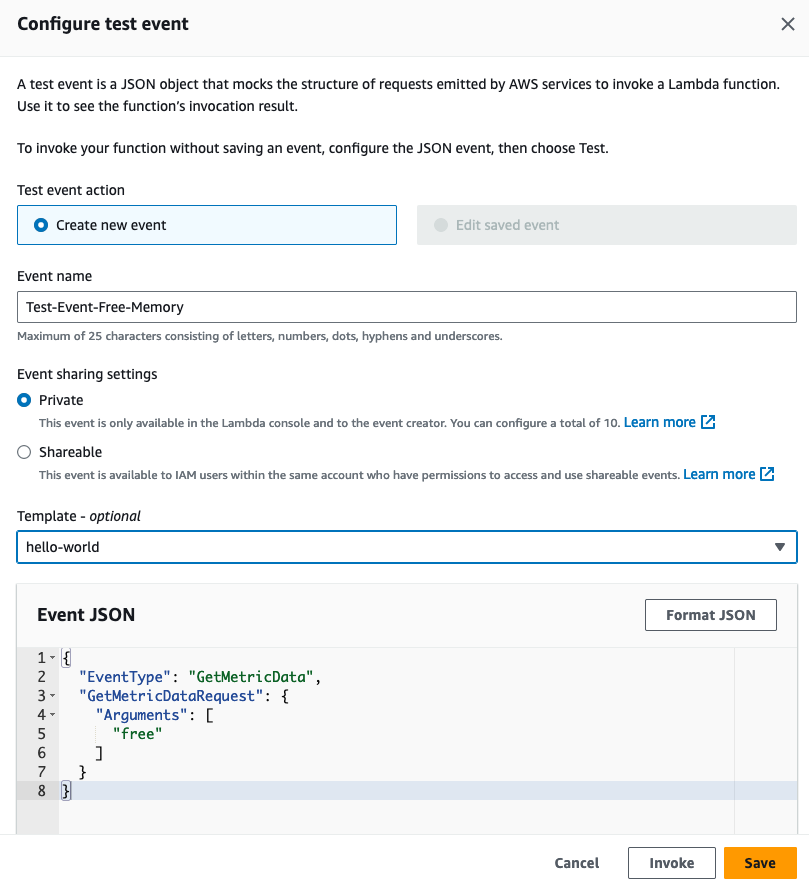
Simply ignore the template setting. Save. Click on test. The function should execute and output something similar to this:
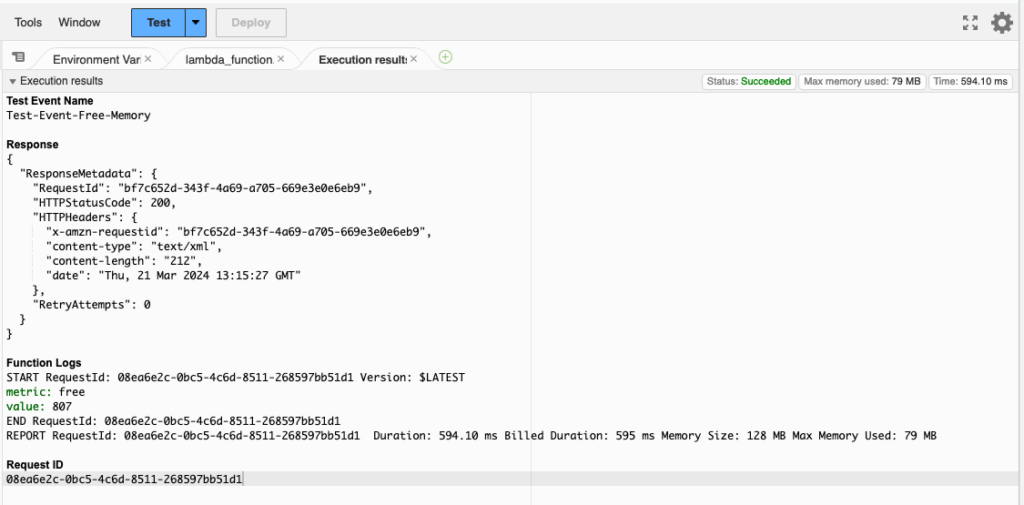
Now we are ready to display the value on a graph.
Graph custom Metrics
Go to AWS Console → CloudWatch → All Metrics and choose your metric (using the defined namespace might speed up things). Select the available metric from the list and you should see a dot representing the value.
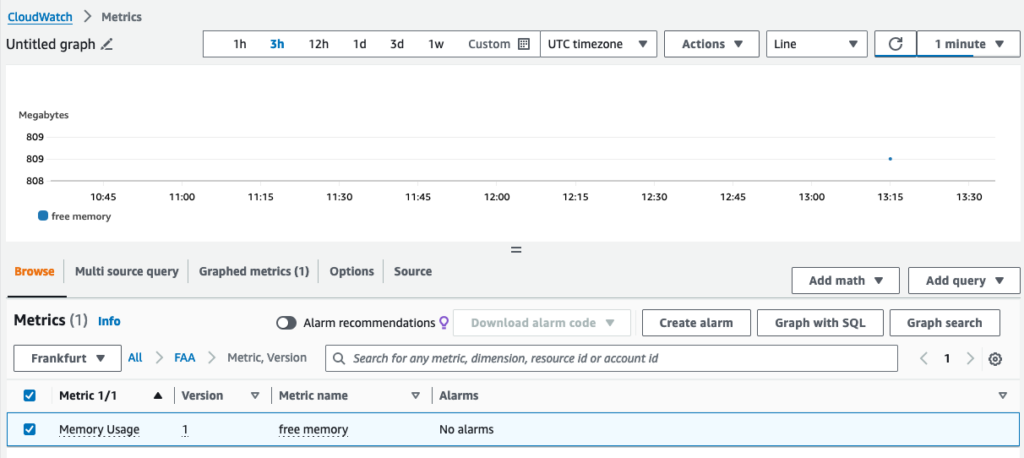
You can set the refresh interval to – for example – 1 minute in order to get a connected representation of the data after some time. Alternatively, you can select your metric via → Multi source query tab where you should be able to select the created data source:
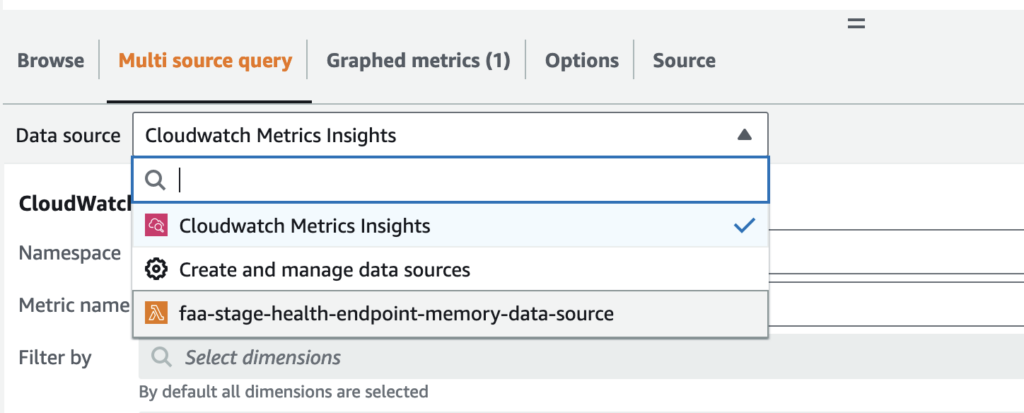
After doing so, AWS should also display the documentation from your lambda code and support you with providing arguments to customize your function’s response value.
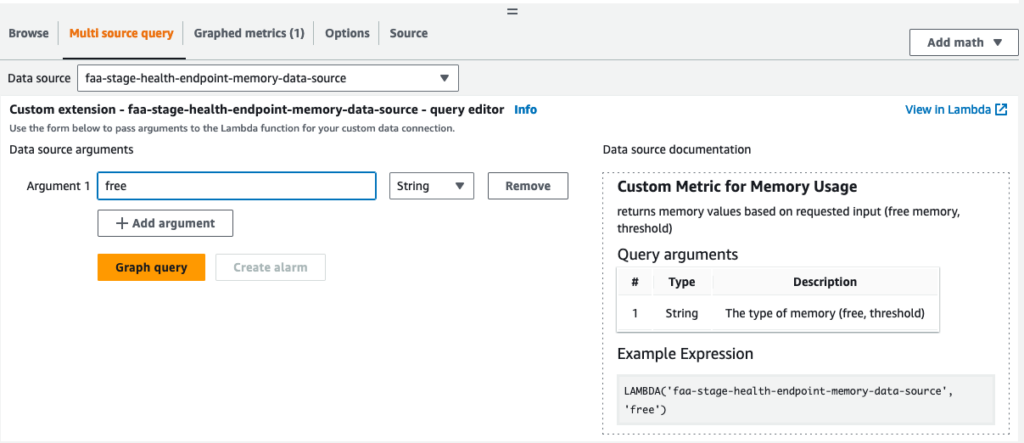
However, this solution has a clear disadvantage (as already mentioned at the beginning of the post): We do not get historical data. How to achieve that will be described in the next chapter.
Trigger Lambda function periodically
In order to get historical data (that means: get past data no matter when we want to display memory information), we need to trigger our Lambda function periodically. We can do this by using AWS EventBridge.
Go to AWS Console → Lambda → Add trigger button
Choose “EventBridge” as source, select “Create a new rule” and add name and description (e.g. “every-10-min” / “execute every 10 minutes”). Select “Schedule expression” as rule type and enter the periodicity, e.g. rate(10 minutes) [4]. If you need more sophisticated execution times, you can also specify a cron expression [5].
Now, we need to adapt the EventBridge configuration as we need to customize the event being sent to our Lambda function. Go to Lambda → Configuration → Triggers menu (left side). On the shown trigger, click on the “every-10-min” rule (alternatively, open via → EventBridge → Rules → { your rule }. Click on → Targets tab → Edit.
Scroll to “Additional Settings”, select JSON as target input and paste the JSON from the Lambda’s test event configuration.
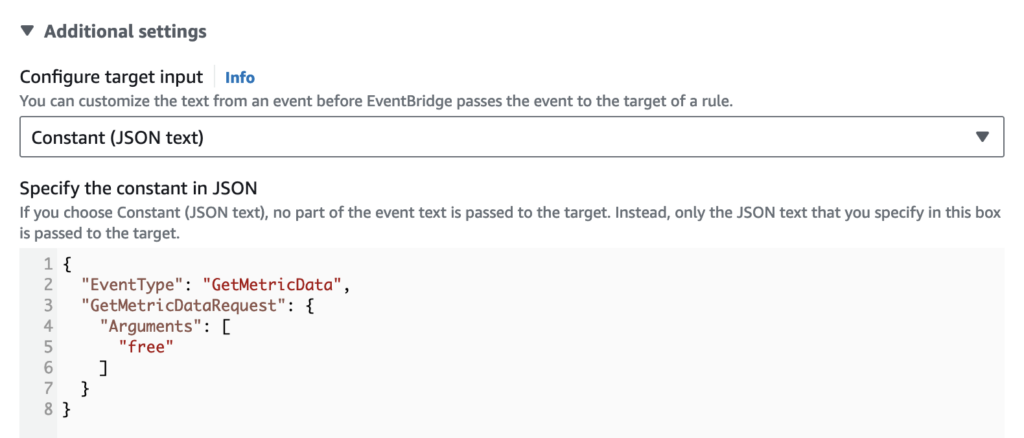
Click through the confirmation buttons to finally update your rule.
Check functionality by looking at the lambda’s CloudWatch logs (→ CloudWatch → Log groups (below “Logs”) → /aws/lambda/{your lambda function name} → select most recent log stream…)
If you still see an error like this
[ERROR] KeyError: 'EventType' Traceback (most recent call last): File "/var/task/memory/lambda_function.py"for most recent call, then your event trigger was not updated correctly, log output should look like this:
2024-03-21T15:00:04.687Z START RequestId: e5fa24e1-5d03-4e95-8494-f441705722ca Version: $LATEST
2024-03-21T15:00:04.688Z metric: free
2024-03-21T15:00:07.487Z value: 785
2024-03-21T15:00:07.528Z END RequestId: e5fa24e1-5d03-4e95-8494-f441705722ca
Show Memory Usage on a Dashboard
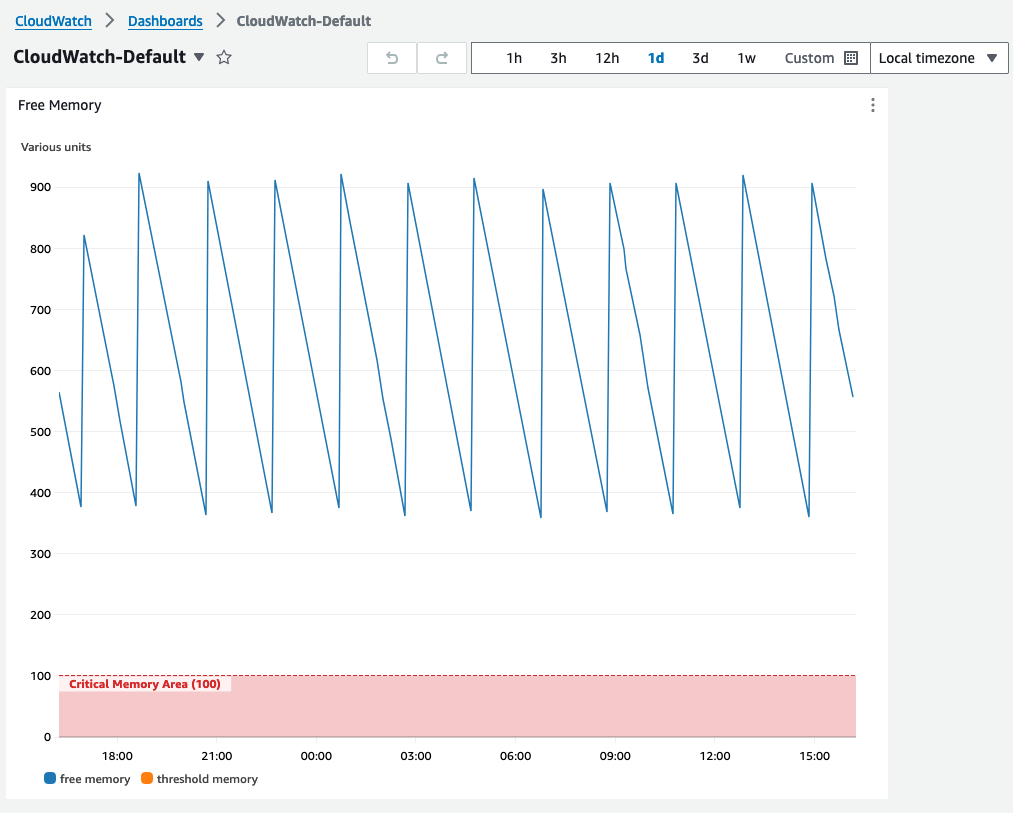
To make our achievements a round experience, we will create a new dashboard being shown on the CloudWatch overview page so we can quickly access our memory trend.
This last step is fairly easy. Just go to → CloudWatch → Dashboards → Create dashboard. Choose “CloudWatch-Default” as name (then it will automatically be shown on the overview page).
- “CloudWatch” as data source type
- “Metrics” as data type
- “Line” as widget type (or whatever suits your needs)
- In “Add metric graph” choose our metric
- Options tab → Left Y axis → Limits Min → 0
- Create widget
After collecting enough data, you might see something like in our case where memory is steadily consumed by background processes and then gets cleaned up at some point by the garbage collector.
Links
[1] – Sending CloudWatch Custom Metrics From Lambda – https://stackify.com/custom-metrics-aws-lambda/
[2] – Connect to a prebuilt data source with a wizard – https://docs.aws.amazon.com/AmazonCloudWatch/latest/monitoring/CloudWatch_MultiDataSources-Connect.html
[3] – Graph a metric – https://docs.aws.amazon.com/AmazonCloudWatch/latest/monitoring/graph_a_metric.html
[4] – Rate expressions – https://docs.aws.amazon.com/eventbridge/latest/userguide/eb-rate-expressions.html
[5] – Cron expressions – https://docs.aws.amazon.com/eventbridge/latest/userguide/eb-cron-expressions.html

